


ESG & Impact Analytics
ESG is broad and ambiguous which makes it susceptible to gamification. Impact is narrow and specific which promotes measurement.
ESG and impact are not the same.
Environment. Social. Governance.
How these three words relate to each other to form an investment framework is not obvious. That they have come to dominate critical areas of asset management is undeniable. And whether their impact on corporations and investors is positive or negative is debatable.
What is certain is there is value in understanding, measuring, and analyzing the ESG impact of a portfolio. This is true whether you are a schoolgirl, a corporate executive, or a skeptic of current things. It is especially true if you are a portfolio manager overseeing the assets of schoolgirls, corporate executives and skeptics.
Like most of life, ESG has become politicized. Its politicization is accelerating which introduces uncertainty and opportunity. One challenge gaining attention is the fiduciary conundrum for investment managers who must choose between optimizing asset allocation for ROI or for ESG impact. Since investing involves tradeoffs and opportunity costs one can also imagine a strategy optimizing for balance between ROI and ESG impact.
Each of these investment strategies demand meaningful ESG explanations that will not be found in corporate disclosures or multi-factor models scanning social media, internet-of-things (IOT), and military movement patterns. Meaningful explanations come from objective processes based on an understandable methodology.
Regardless of ESG philosophy and motivation, one needs unbiased, accurate measures of impact. These measures are not in bundled scores produced by aggregating the myriad combinatorial outcomes of every (E) x (S) x (G) factor into an inexplicable number. Rather, an appreciation for tradeoffs recognizing most investments are not absolutely ESG positive or negative demands a clearer methodology.
One benefit of Point Focal’s inclusion in the Sand Hill East portfolio of companies has been engaging with a company whose presence in the portfolio is born from its vision to deliver a novel ESG solution. Util analyzes 120 million peer reviewed texts with natural-language processing to extract relationships and map revenue between company products and the 17 United Nations Sustainable Development Goals (UN SDGs).
In doing so, Util addresses the shortcomings of legacy ESG scores: bundled aggregations, noisy source data, and unexplainable methods. And by flipping the ESG model to one that measures impact in the direction of companies to outcomes rather than externalities to holdings, Util’s framework can be used to produce the ESG analytics schoolchildren, corporate executives, and skeptics have long sought.
Greta, Larry, and Elon, take note.
UN Sustainable Development Goals are the nearest representation of a universal ESG benchmark. Born in 2015, the closest approximation to normalized, outcome-based objectives are becoming a must-have input into ESG investment processes. UN SDGs have a target due date of 2030, itself an explicit acknowledgment that ESG impact can be tracked and measured.
This is an inflection point for ESG analytic utility. Finally, and for the first time, client demand and regulatory requirements necessitating a new ESG understanding can be satisfied.
Tony Fadell, the product genius behind iPods, iPhones, and Nest Thermostats, explains in Build that the best products are painkillers, not vitamins1. You can skip a vitamin and not notice an effect. Skip a painkiller and you experience suffering.
Util ESG analytics are painkillers helping their most important stakeholders: clients and regulators.
As much fun as it is to write about ESG analytics, it is more fun to design ESG analytics. Whether in our product or in this Substack, it is the combination of visual data design and narratives that create insight.
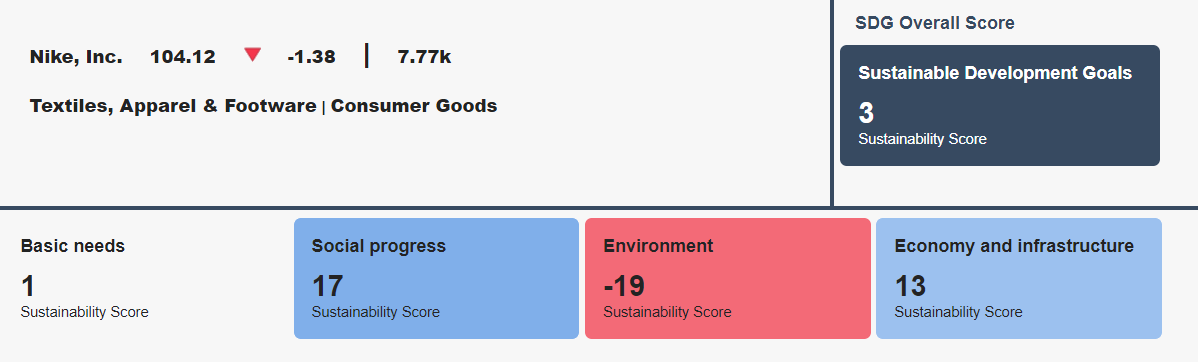
Nike is a useful case study. Before assessing impact, let’ s define Nike:
Nike, Inc. is an American multinational corporation that is engaged in the design, development, manufacturing, and worldwide marketing and sales of footwear, apparel, equipment, accessories, and services.
There is a lot to unravel from this one sentence description. A U.S. based international conglomerate operating across an important set of functions, geographies, and impact areas. More than a swoosh.
Let’s begin with the overall Util Sustainable Development Goals score. The number 3. By itself, uninstructive. But by understanding the underlying metrics that produce the 3 within the context of a broader portfolio or benchmark, the number 3 becomes insightful.
Start with the premise that impact is not universal or absolute. It is about context, incentives, and goals. All of which are moving targets set by shareholders, asset managers, and investors.
What companies do is worth more of our attention than what companies say they do. And yet it is easy to become obsessed with company disclosures, press releases, and analyst opinions. It has been difficult to focus on company actions. Until we could see product revenue mapped to UN SDGs.
Until Util2.
Here is the Nike swoosh laid across the United Nations Sustainable Development goals. The 17 UN SDGs are ordered along the Y axis. Percent of Nike revenue positively and negatively aligned to each SDG is presented on the X axis.
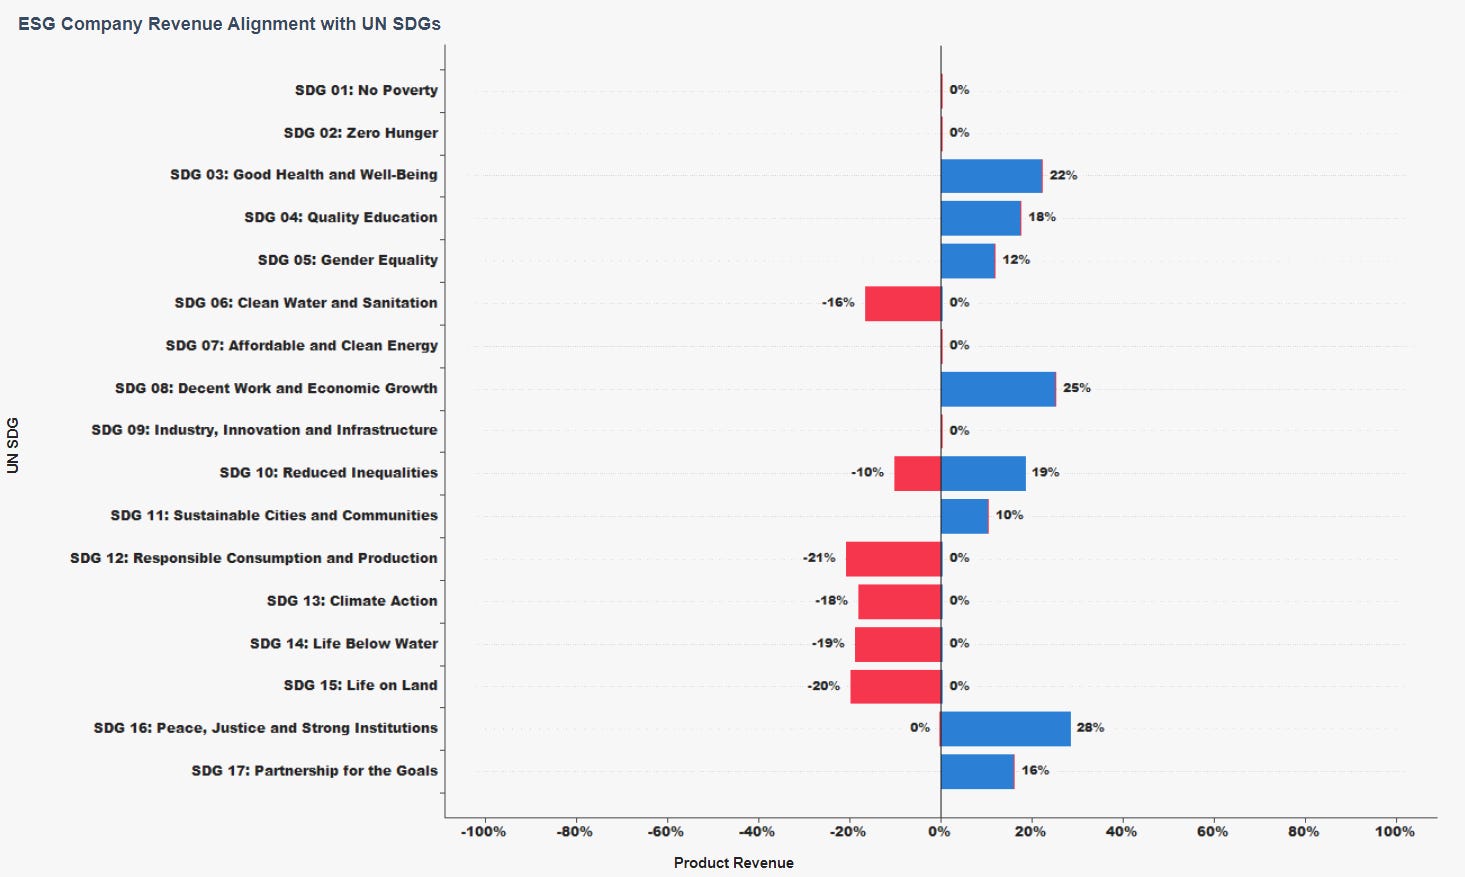
First impressions include realizing that impact is not absolute. Aggregated ESG scores require unbundling and Util’s Nike score is no exception. What is unusual about Util is its framework is designed to enable an objective unbundling. Nike’s revenue is positively aligned with 8 SDGs and negatively aligned with 6 SDGs. This moves us toward understanding and optimizing investment impact.
Nike’s most positive impact is on SDG 16, “Peace, Justice, and Strong Institutions” and SDG 8, “Decent Work and Economic Growth” where 28% and 25% of product revenue is positively aligned, respectively.
Nike’s negative impact is clustered around SDGs 12 through 15: “Responsible Consumption and Production”, “Climate Action”, “Life Below Water”, and “Life on Land”. One does not need to be a famous schoolgirl or an executive to appreciate that these SDGs reflect environmental impact.
Util provides a useful classification of UN SDGs that sits between overall scores and individual SDGs. Nike’s strongest positive impact SDGs fall into Social Progress and Economy & Infrastructure categories. Each of Nike’s most negative impact SDGs are in the Environment category.
Util UN SDG Categories
Basic Needs
SDGs 1, 2, 3, 6, 7 (No Poverty, Zero Hunger, Good Health and Wellbeing, Clean Water and Sanitation, and Affordable and Clean EnergyEconomy and Infrastructure
SDGs 8, 9, 11, 17 (Decent Work and Economic Growth, Industry, Innovation and Infrastructure, Sustainable Cities and Communities, and Partnerships for the Goals)Social Progress
SDGs 4, 5, 10, 16 (Quality Education, Gender Equality, Reduced Inequalities, and Peace and Strong Institutions)Environment
SDGs 12, 13, 14, 15 (Responsible Consumption and Production, Climate Action, Life Below Water, Life on Land)
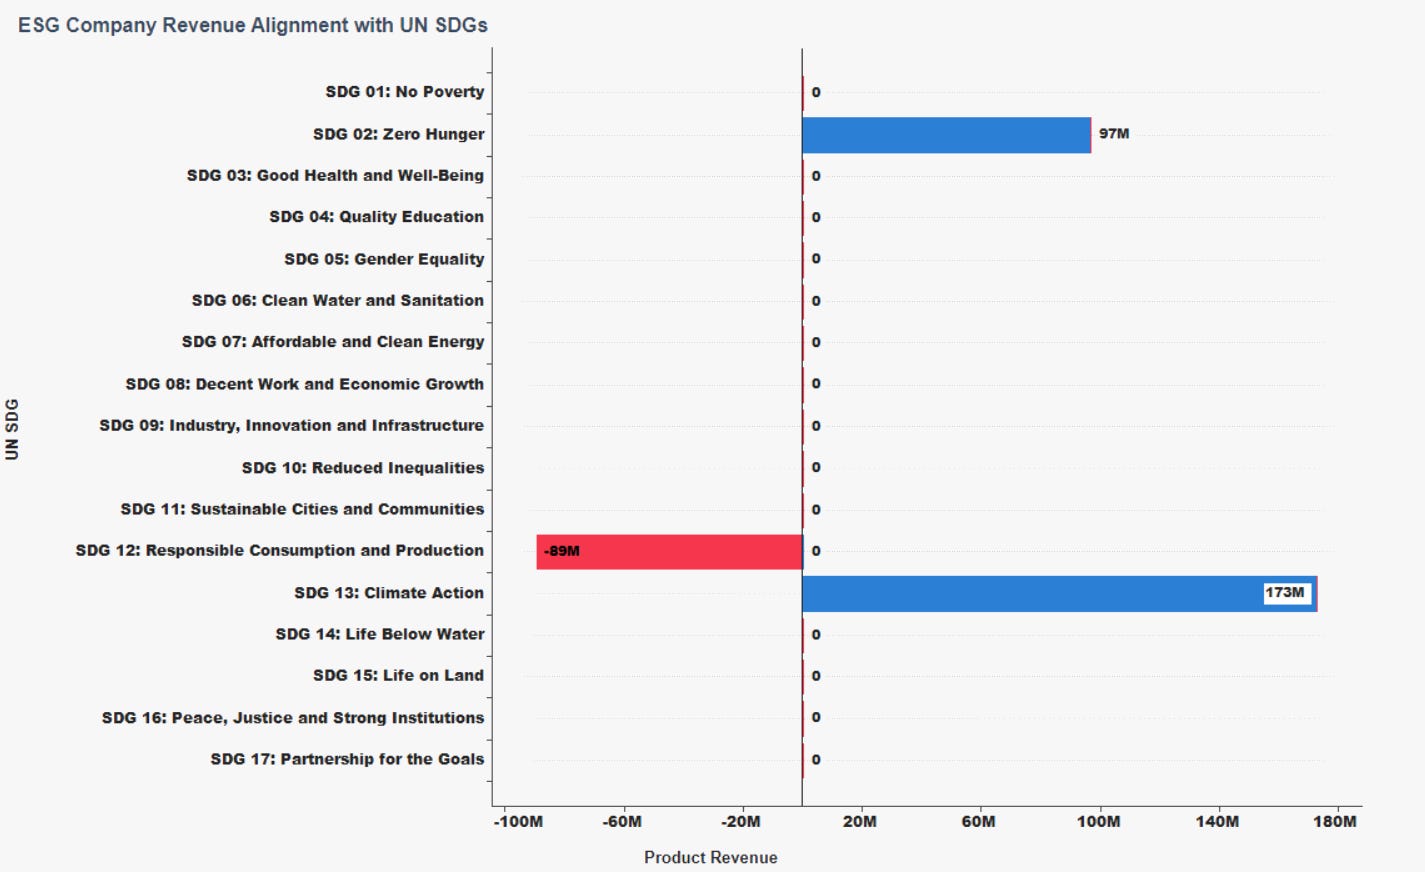
Analyzing company percent of revenue aligned to UN SDGs is a helpful way to compare relative impact. But context matters. Twenty-eight percent of Nike revenue is $12.6B. Comparatively, thirty-seven percent of Beyond Meat revenue is positively aligned to UN SDG 13, “Climate Action”. But thirty-seven percent of Beyond Meat revenue is $173M, or 1% of the comparable Nike impact.
Actions matter, but so too does scale.

Accurately assessing ESG investment impact requires understanding corporate revenue allocations to goals and the scale of that revenue. This is true for asset managers with portfolios spanning market caps from nano to mega and for those “simply” tracking the S&P 500.
Context matters from stock selection to rebalancing, and all the way through to quantifying impact for clients and regulators (not necessarily in that order).
Beyond Meat’s stated mission is aligned with UN SDG 13, “Climate Action”:
Producing a Beyond Burger uses significantly less water, land and energy – and it generates fewer Greenhouse Gas Emissions (GHGE) than a beef burger.
However, their negative product revenue aligned with SDG 12 “Responsible Consumption and Production” is more than 50% of their positive revenue aligned with “Climate Action”.
Corporate actions mean more than corporate communications.
Attribution can also cut both ways on a single SDG. 19% of Nike revenue positively impacts SDG 10 “Reduced Inequalities” while 10% of its product revenue negatively impacts the same goal.
Lack of impact is also worth considering when measuring ESGness. Nike’s impact spans thirteen of the seventeen UN SDGs. Meanwhile, Beyond Meat only impacts three SDGs without touching Economy and Infrastructure or Social Progress categories. Like fighter jets that never return from war, sometimes we need to analyze what we cannot see.
All this is to reiterate that impact is not absolute. Even in a 2-stock portfolio, each company and goal requires analysis that identifies tradeoffs and explains outcomes. A universal approach with clear attribution can measure investment, portfolio, and fund impact.
Corporate revenue allocations to goals are the foundation of impact knowledge. Util’s methodology accounts for corporate product lines enabling a deeper impact analysis. Companies and investors can isolate product contributions to impact. This is further unbundling.
Nike’s overall score of 3 is less informative than its scores across Basic Needs, Social Progress, Environment, and Economy & Infrastructure categories.
Likewise, the four categorical scores are less informative than the seventeen impact measures, positive and negative, across Sustainable Development Goals. By adding the product mix to the equation ESGness becomes more granular.
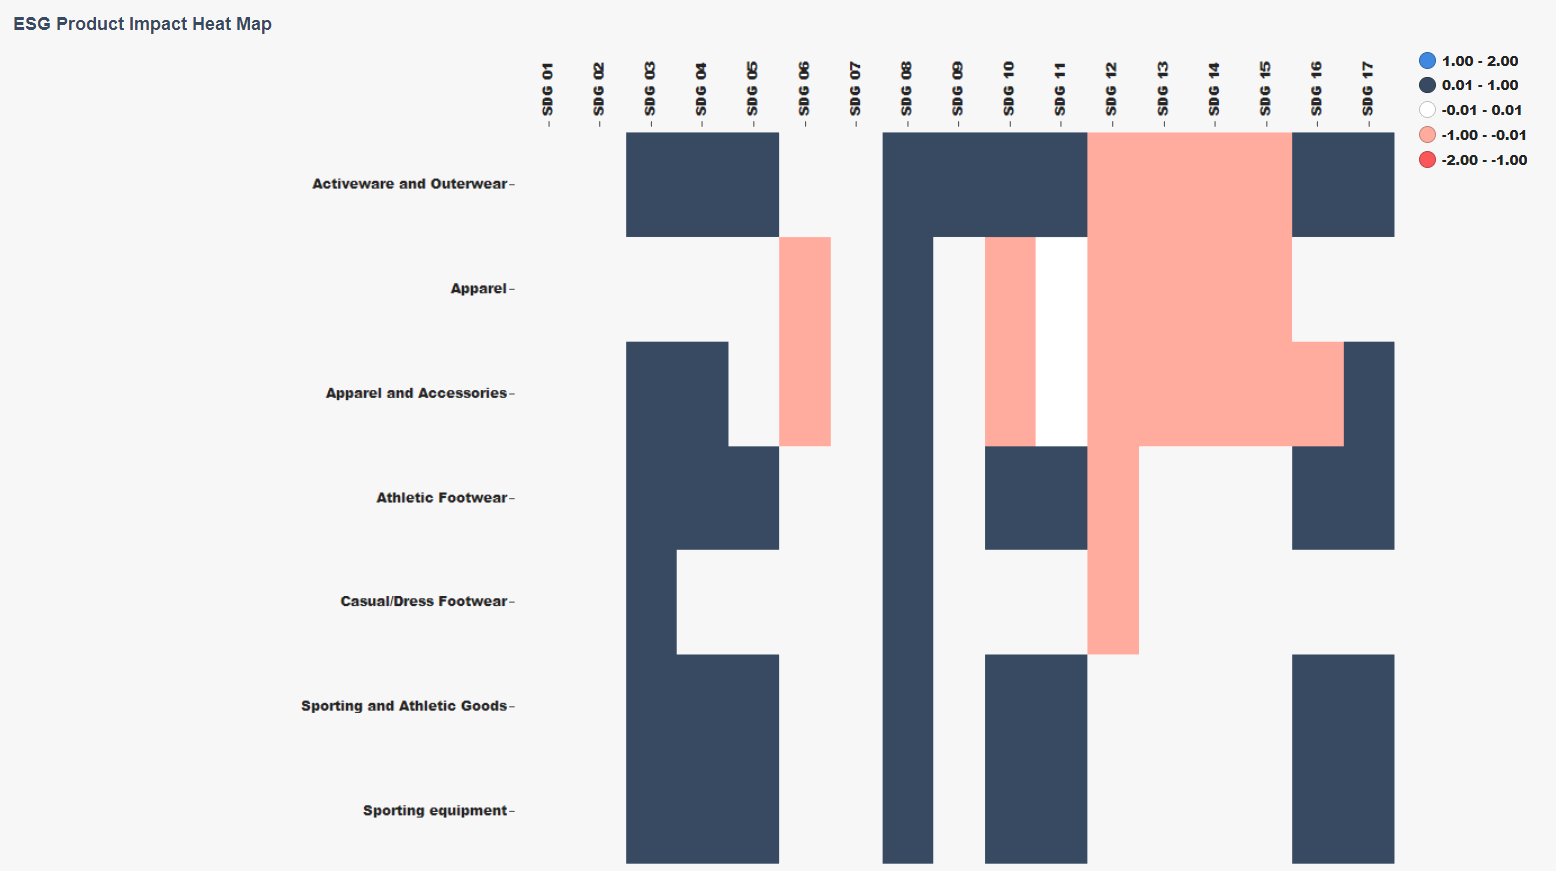
Nike’s seven product lines do not have equal impact. Two of them, Sporting and Athletic Goods, and Sporting Equipment, have entirely positive impact. The other five product lines have mixed impact with Apparel and Apparel & Accessories products accounting for the most negative impact.
This can be viewed in our product heat map where Nike’s negative impact on UN Environment SDGs 12 through 15 can be observed across its products.
Building analytics is often about navigating between macro and micro themes. Themes that should be integrated through data & analytics such that one helps explain the other. One of the most important analytic considerations is the three-word query, “compared to what?”
We have gone end-to-end in our assessment of company impact. But capital allocators must navigate both macro and micro themes to answer the “compared to what?” question. Here macro to micro means market to industry to sector to company.
Nike, as compared to the rest of the Consumer Goods sector, is more informative than Nike in isolation. In each of the eight UN SDG impact measures where Nike has positive impact, Nike outperforms the broad Consumer Goods sector. And with respect to negative impact, Nike beats its sector on three of six metrics.
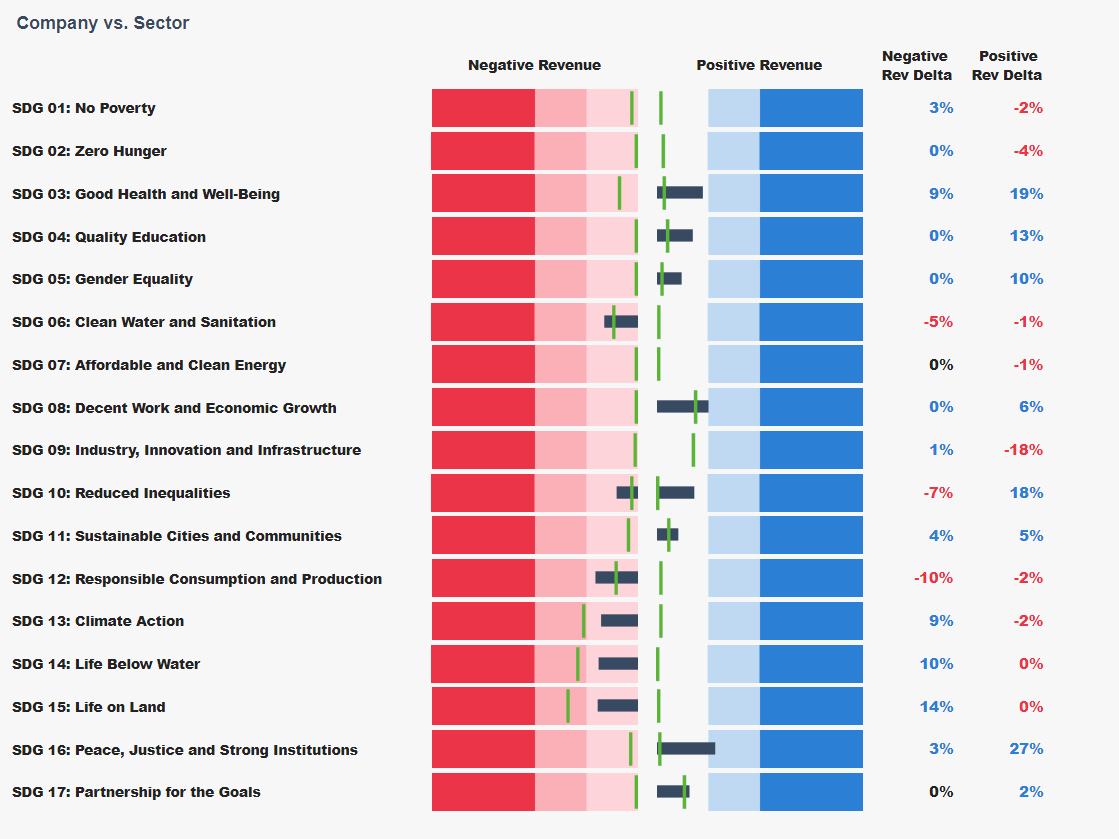
Our company vs. sector bullet chart condenses comparative information into a single view. If you’re not familiar with the format, a brief explanation will help with interpretation.
Each horizontal “bullet” represents a single UN SDG. Let’s focus on SDG 8, Decent Work and Economic Growth. The dark-blue, horizontal bar informs us that Nike has positive (rightward) impact on SDG 8. Because the bar exceeds (is rightward of) the green vertical line reflecting the sector average, we also know Nike outperforms its sector on this metric.
From a prior view (and from hovering over the bar in our application), we know Nike’s percent of positive revenue impact for SDG 8 is 25%. And the positive revenue delta score of 6% for SDG 8 informs us that Nike is six percentage points better than the sector score of 19%.
The background color bands are red for negative revenue and blue for positive revenue. Shading cutoffs appear at 25% and 50%.
Nike impact is superior to its sector impact across 11 of 14 total metrics. And while in isolation Nike’s impact across the Environment category appears poor, its impact is better than the Consumer Goods sector impact on 3 of the 4 related SDGs.
Enabled with narrow and specific ESG analytics, investment managers can consider impact during ideation and portfolio construction. Companies can be assessed to determine if inclusion will strengthen or weaken portfolio impact.
Considering Nike’s weakest environmental impact on SDG 12, Responsible Consumption and Production, one could specifically filter for companies with positive impact, and scale, on the same SDG.
ESG criticism is escalating of late. And to be fair, much of the criticism is fair. Endless greenwashing and blindly sacrificing corporate goals for the next ESG current thing begs for skepticism.
But ESG is not going away. It is benefiting from its critics and being forced to mature. Separating impact from ESGness is like pulling signal from noise. It addresses the skepticism by moving the space closer to the truth.
These market forces are creating opportunity to thoughtfully apply impact awareness to investing. As asset managers and service providers embrace this development new investment processes will arise.
Here’s one: impact rebalancing.
To that end, let’s look at Nike’s impact profile within the S&P 500. By plotting overall score on the Y axis and then assessing various SDG category scores on the X axis we can understand where Nike sits within the benchmark.
Recall Nike’s overall score is 3 and since that metric remains static on the Y axis, in the below visualizations Nike remains in the same vertical space. However, as we assess S&P 500 impact on Social Progress and the Environment, we see Nike moves across horizontal space.
By highlighting Nike within the benchmark, we can observe absolute and relative impact. Because Nike’s position has moved from right to left, we know its Environment impact is worse than its Social Progress impact. But we can also observe relative impact. There are only a handful of companies that perform better than Nike on Social Progress SDGs (Quality Education, Gender Equality, Reduced Inequalities, and Peace and Strong Institutions). However, Nike has average impact on Environment SDGs (Responsible Consumption and Production, Climate Action, Life Below Water, Life on Land).

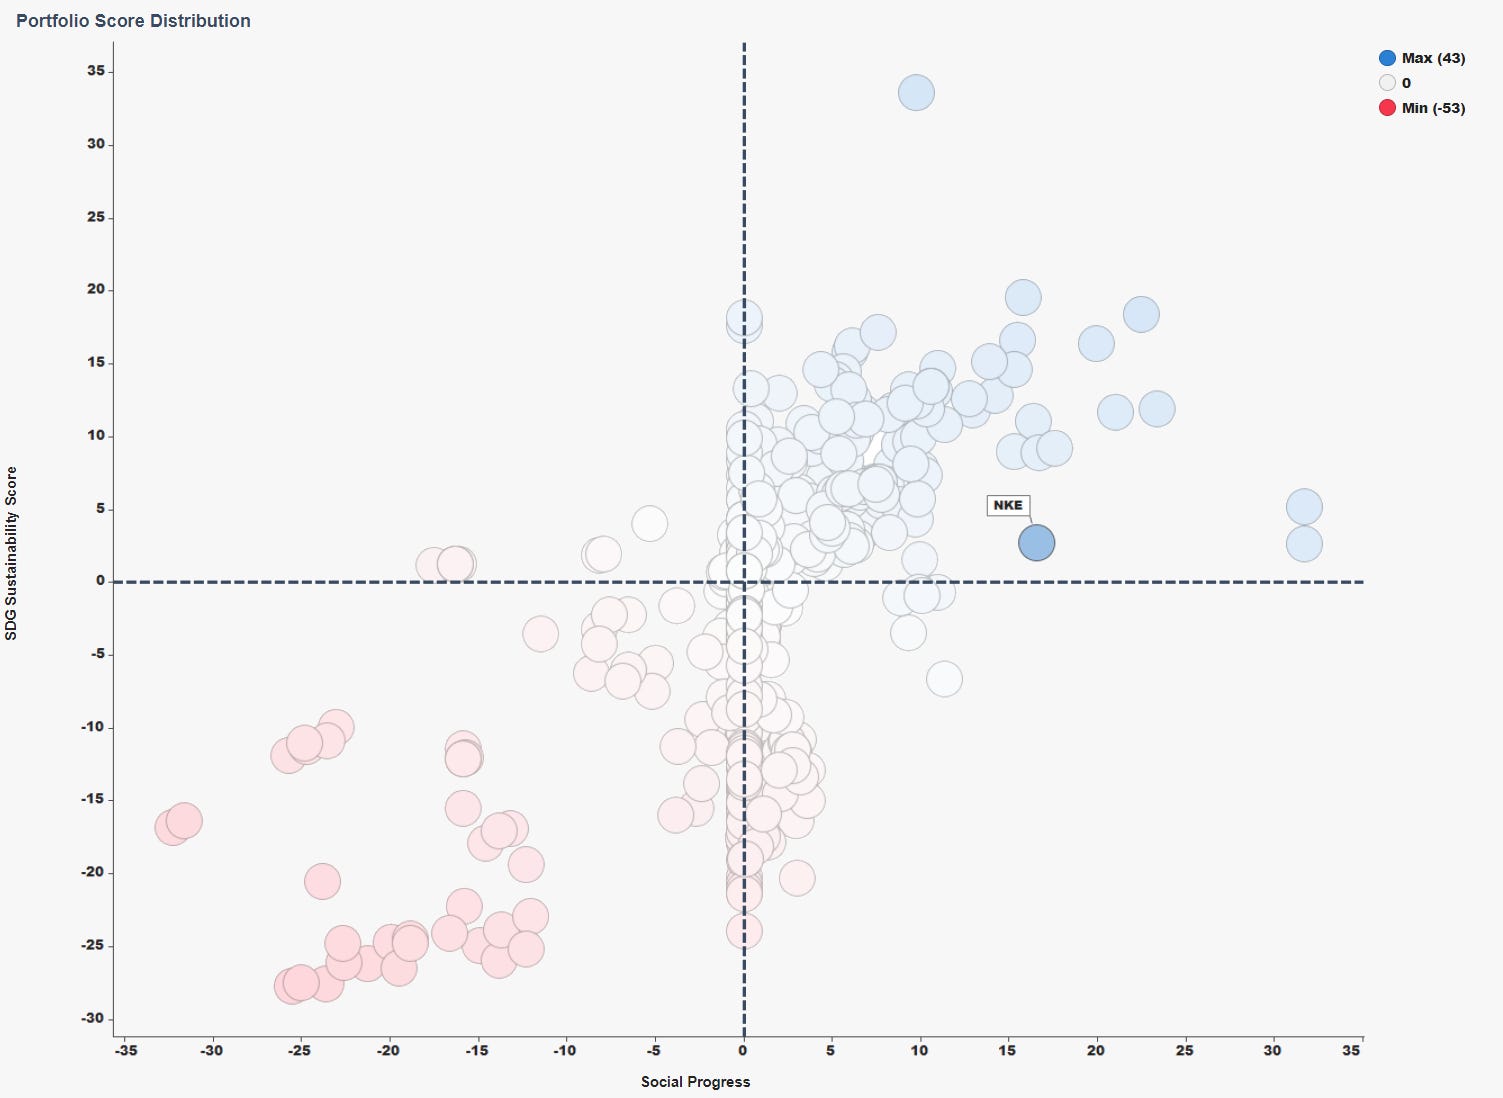
The distributions inform us that the entire S&P 500 impacts the environment more negatively than social progress. Both in number of companies and severity of impact.
Our next set of Util views extend this portfolio analysis. We’re making it simple to compare impact of any set of portfolios to themselves or to their benchmarks. And we are modeling how changes in composition will affect portfolio impact.
Util analytics are the painkiller for the world’s ESG challenges. They are a leveling mechanism that does more than align companies to goals. They align diverse stakeholders representing ESGs strongest supporters and fiercest critics.
On Util’s website, the acronym ESG appears only in the context of an award won: “ESG Research of the Year, North America3.” From the report:
“ESG funds have no significant additional positive impact compared to non-ESG funds.”
This is what it looks like to embrace ESG skepticism. But unlike most skeptics, Util has a solution. Objective, measurable data capable of answering the question, “compared to what?”
ESG redefined and spelled out: impact analytics.
How is “Until Util not a marketing campaign?
The Sustainable Investment Awards, 2022.
.png)


