


Informing Portfolio Turnover
If you want to reach a large market, start with a small market1. A minimally viable market. One adjacent to asset management with large network effects might be optimal for a portfolio analytics firm.
Investment managers (IMs) are fired and hired regularly. It’s why performance, marketing, and relationships matter. And not necessarily in that order. When large institutions like pension funds fire one IM and hire another IM, they need to transition their assets from one to the other.
From a legacy portfolio to a target portfolio.
To do so, they use some of the world’s largest asset service providers. Because raising cash by liquidating one portfolio while spending cash to invest in another portfolio is more challenging than it sounds. Consider transitioning several hundred million dollars across global markets spanning four asset classes. Now do it with the VIX over 30.
Not as simple as selling META to buy XOM in a Schwab account.
Enter transition managers (TMs): State Street, Macquarie, Northern Trust, Russell. They will transition assets from legacy to target portfolios in a market neutral fashion while minimizing market impact. And they’ll charge commissions or flat fees financial institutions are happy to pay.
Demand, the firing and hiring of IMs, is high. Supply, transition managers, is low. And the assets involved are large. Revenue is recurring because today’s hired IM is tomorrow’s fired IM.
Transition management is a small market, adjacent to asset management, with large network effects.
We’re building market structure sentiment analytics for transition managers. When we’re done, we will have a TM solution, and an analytic workflow that can be applied to any event-driven, episodic investment process, including program trading.
And we’ll have a market structure sentiment quantitative model.
We are modeling a baseline of selling a legacy portfolio and buying a target portfolio in a simple, market-neutral process. And we’re comparing the baseline to a model of selling the same legacy portfolio and buying the same target portfolio using market structure sentiment to inform position entries and exits and buying and selling aggressiveness and passiveness.
If market structure sentiment can meaningfully explain price setting behavior, our model will improve transition manager performance.
We envision a pre-transition report with the following portfolio information:
Average market structure sentiment (demand) and short-volume (supply)
Demand and supply distributions
Average dominant behavior activity (Fast Trading, Active, Passive, Risk Management)
Distribution of positive and negative demand / supply divergences
Demand direction breadth percentages (topped, rising, declining, bottomed)
Supply direction breadth percentages (rising, declining)
Market behavior profiles percentages (big and stable, active divergence, momentum, short trades, liquid volatile divergence)
Aggregations across market-cap, sector, and market behavior
Pre-transition reports will quantitatively demonstrate how the legacy and target portfolios differ across these market structure sentiment metrics. And they will provide a basic model of how using market structure sentiment to inform the liquidation and purchase of legacy and target portfolios can reduce market impact and improve performance.
A critical market structure sentiment metric is divergence. Whether securities have demand and supply (sentiment and short volume) moving together or apart. The pace at which divergence and convergence are occurring. And the extremeness of divergence.
For the sake of this Signals piece, we’ll use divergence to explain an initial market structure sentiment model2.
An Alt-Data Story Explainer, well, explains, why market structure sentiment matters3:
Beneath market activity is market structure. And beneath market structure is market structure data. 605 best execution, 606 order routing, and FINRA Reg SHO short volume. Market structure sentiment. Demand and supply. The data that explains the stories.
Because we have 2 portfolios (legacy and target) and 2 profiles (positive demand / supply divergence and negative demand / supply divergence), there are 4 resulting market structure sentiment strategy profiles:
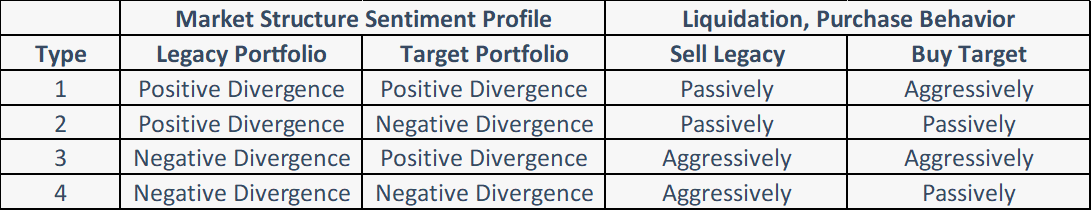
Let’s use a simple example of demand and supply divergences. Consider a legacy portfolio with average sentiment of 6 (on a 1-10 scale) and average short volume of 40%. And consider a target portfolio with average sentiment of 3 and average short volume of 60%.
Legacy portfolio: demand = 6, supply = 40%
Target portfolio: demand = 3, supply = 60%
Holding other factors constant4, relative to each other, the legacy portfolio has a more favorable market structure sentiment profile (high-demand, low-supply) compared to the target portfolio (low-demand, high-supply).
Therefore, on a relative basis, it is statistically more likely for the legacy portfolio to make gains during the transition event and more likely for the target portfolio to suffer losses. Since the legacy portfolio is being sold and the target portfolio is being bought, transition managers can reduce market impact and improve performance by behaving more passively than aggressively with respect to both portfolios during the event.
In this scenario, market structure sentiment can be used to model more passive liquidation behavior to capture gains by selling the legacy portfolio into market structure strength. Likewise, passive behavior will be modeled for purchases to reduce acquisition cost by buying the target portfolio into market structure weakness.
Note that if the target portfolio exhibited a positive market structure sentiment divergence (like the legacy portfolio), buying behavior would be modeled more aggressively, to reduce acquisition costs by avoiding paying higher prices (buying the target portfolio into market structure strength).
Every transition has a duration: the number of days during which the transition will occur. Let’s make this transition’s duration 5 days. The baseline model will sell the legacy portfolio and buy the target portfolio evenly over the 5-day period, with market-neutral sales and purchases occurring throughout the event. The market sentiment strategy (type 2 from the profile table above) will sell the legacy portfolio and buy the target portfolio more passively than the baseline model throughout the event.
The two models are presented below:
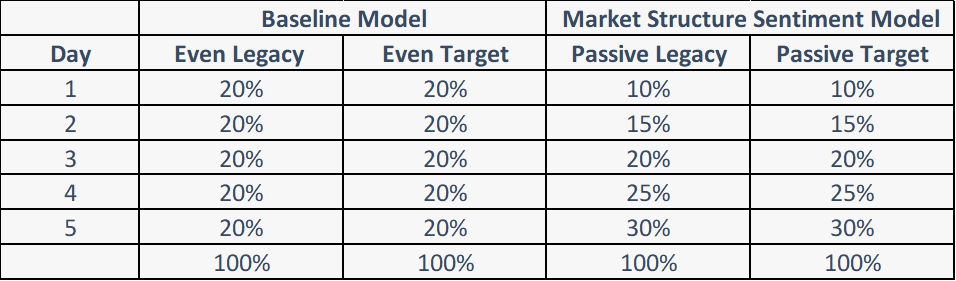
Models will be evaluated by analyzing the net dollar value amount of raising cash by selling the legacy portfolio and spending cash by buying the target portfolio. If the baseline model raises $297M over 5 days selling the legacy portfolio and spends $303M over 5 days buying the target portfolio, the cost of transitioning from one IM to another (before TM fees) is $6M.
If the market structure sentiment model raises $299M over 5 days selling the legacy portfolio and spends $301M over 5 days buying the target portfolio, the cost of the transition is $2M (plus TM fees).
This is our objective: a better economic outcome using market structure sentiment analytics.
A post-transition report will include the following portfolio information:
Market structure sentiment profiles and metrics throughout the event
Liquidation and purchase amounts (cash raised and spent) throughout the event
Baseline and market structure sentiment model comparative performance metrics
This is the beginning of a portfolio analytics model on which we will expand. We will add other metrics beyond divergence to the analysis. We will map the degree of divergence to the levels of liquidation and purchasing aggressiveness and passiveness. And we will assess market structure sentiment more frequently throughout the event.
We will also build a stand-alone market structure sentiment quantitative model that can be used by any asset manager. The model will compare benchmark performance of buying and holding a portfolio of securities to a strategy of using market structure sentiment analytics to reweight the portfolio.
We will share the analytics described herein as we produce them. I suspect they will create utility for investment processes we have yet to consider.
For now, we will pursue a small market.
PayPal’s first minimally viable market was a cohort of eBay users. PayPal, having been acquired by and spun off from eBay, produces 25B in revenue. eBay produces 10B in revenue.
Please do not use this scoping of an analytic model as a basis for any investment decisions or to manage a transition. Please wait for the real product which will include a real disclaimer.
For additional market structure sentiment context, see Signals posts S&P 500 Sector Analysis and Short Volume and Market Behaviors.
Factors can be held constant in theory. Not in practice.
.png)


