


S&P 500 Sector Analysis
Introduction
Market structure sentiment is derived from 605 best execution and 606 order routing exchange flows coupled with FINRA short volume1 activity. Flows and activity are modeled in a demand supply framework. Active, Passive, Fast Trading, and Risk Management market behaviors and average price are inputs into demand sentiment scaled between 1 and 10. Short volume is supply measured as a percentage of total volume.
Demand Supply Quadrants
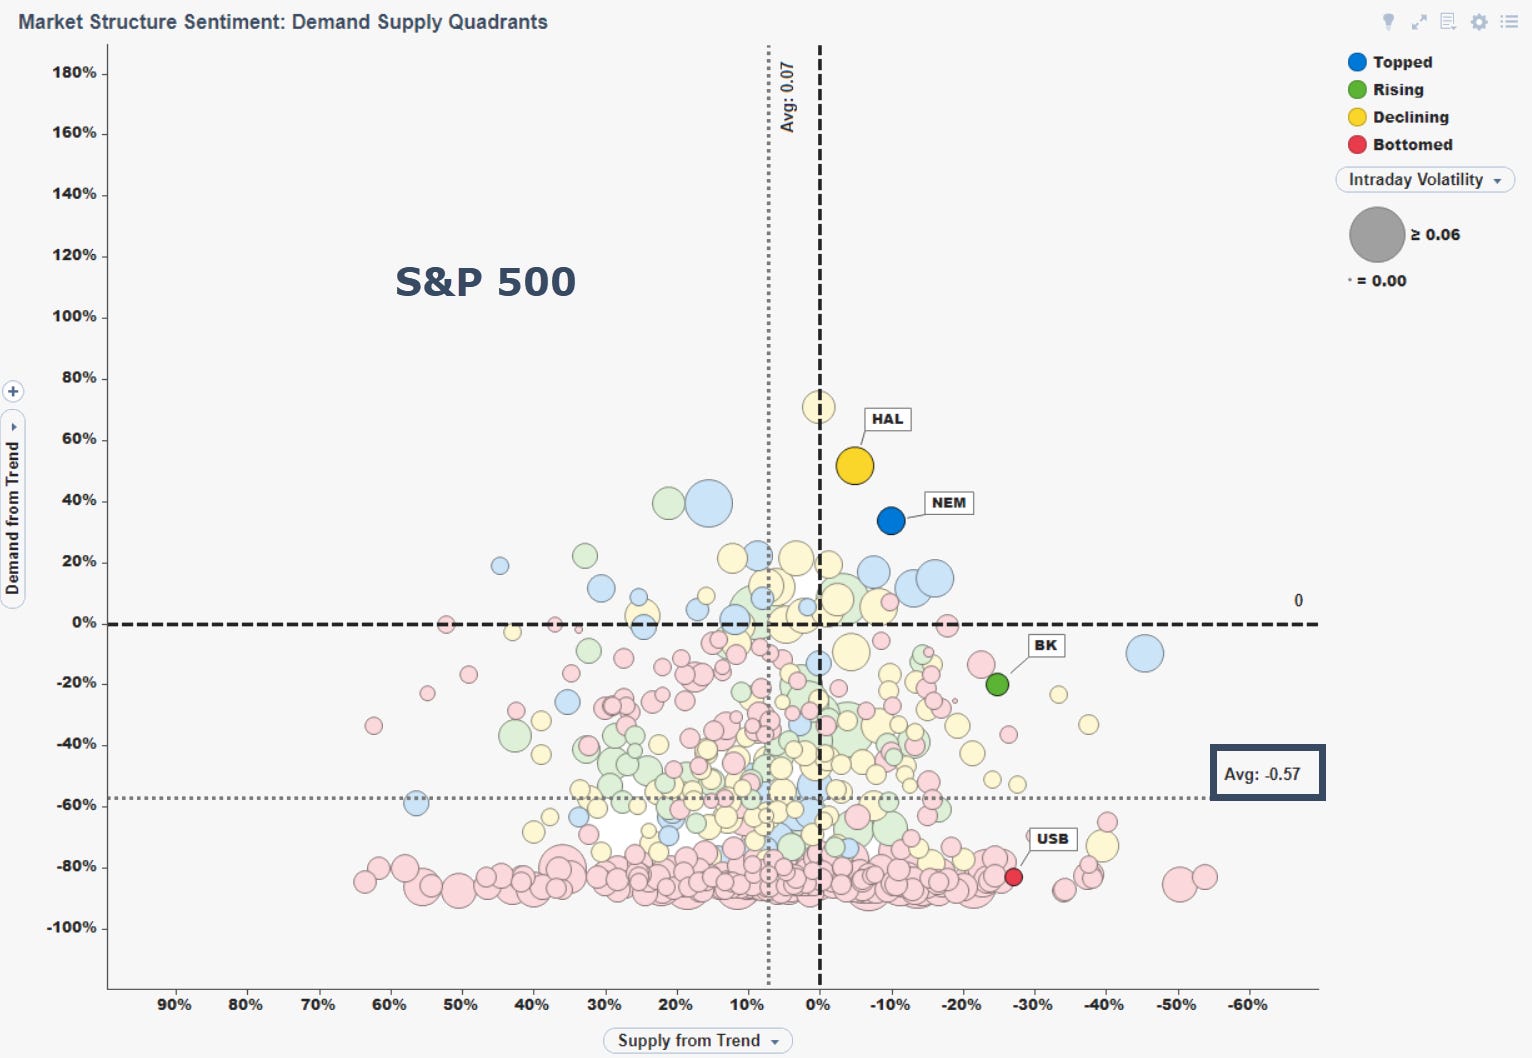
Our market structure sentiment demand supply quadrants plot the distribution of each stock’s current distance from demand and supply trends. Demand distance is current demand less 30-day demand. Inversely, supply distance is 30-day supply less current supply. These formulas reflect that high demand signals strength and high supply signals weakness.
In the visualization, note that Supply from Trend on the X axis is inverted which enables a simple heuristic when interpreting the scatter plot: up-and-to-the-right signals strength (high-demand, low-supply) and down-and-to-the-left signals weakness (low-demand, high-supply).
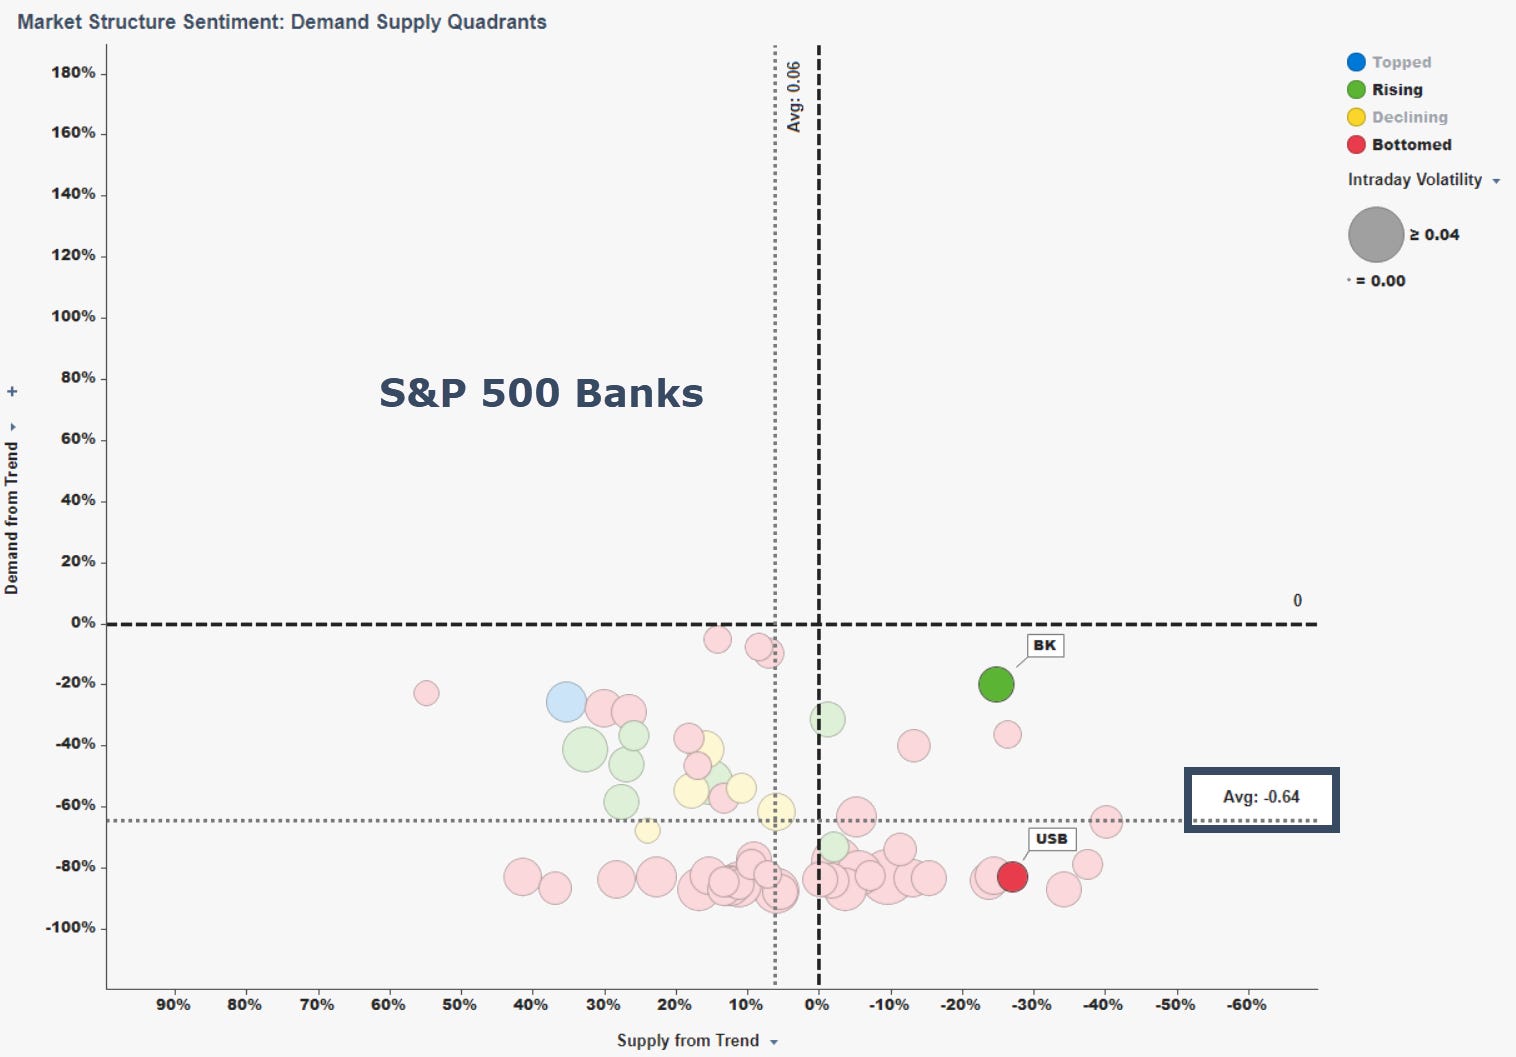
The strongest demand supply divergence for Banks is BK. Nevertheless, its current demand is still more than 20% under its 30-day demand. And all Banks are averaging demand sentiment 64% under their 30-day demand. Quadrants can be used to identify divergences.
The market structure sentiment demand supply profile of Mining, Oil, and Gas stocks has a very different distribution than Banks. Most Mining, Oil, and Gas stocks have demand above trend (Y axis) with their cycles topping and declining.
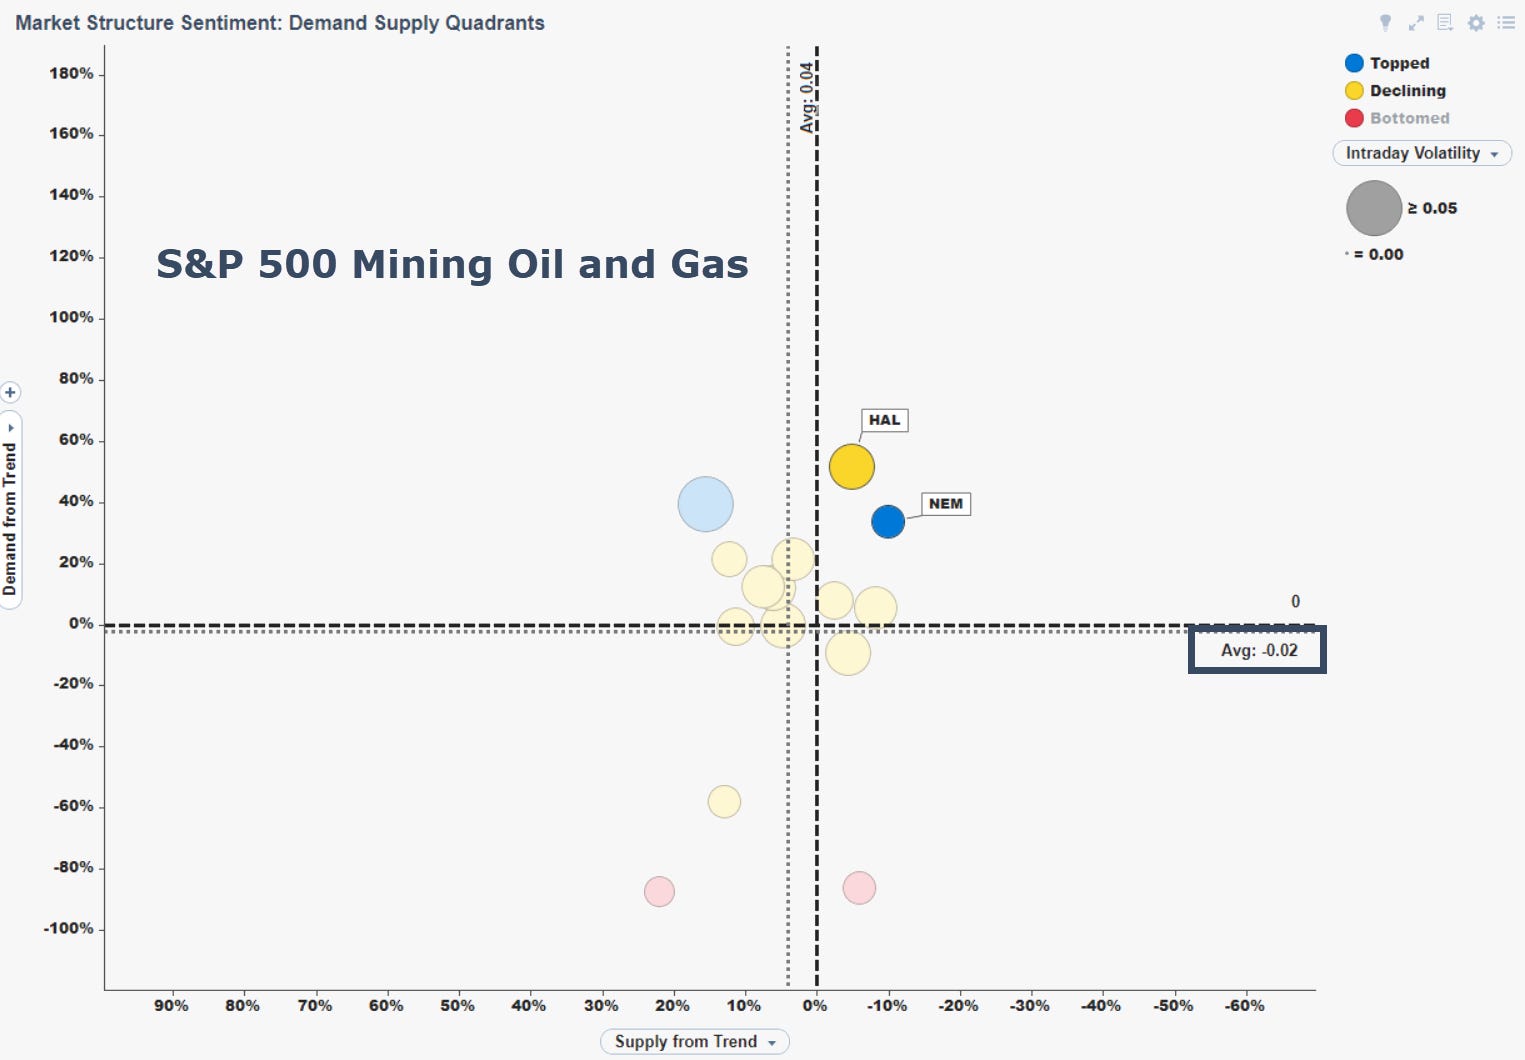
While BK has the strongest demand supply divergence profile (up-and-to-the-right) among Banks, its profile is weaker than the average demand of Mining, Oil, and Gas stocks. Understanding context strengthens market structure sentiment analysis. Context is relating demand and supply strength or weakness across stocks, sectors, portfolios, and benchmarks.
Following the 9/1/22 Bank bottoming cycle, the Bank ETF KRE rallied over 6% from 9/6 to 9/12. As observed below, this is consistent with the bottoming cycle and subsequent rally in the broad market. The Energy ETF XLE (representing Mining, Oil, and Gas stocks) rally over the same period was relatively weaker: 3.5%.
Distributions
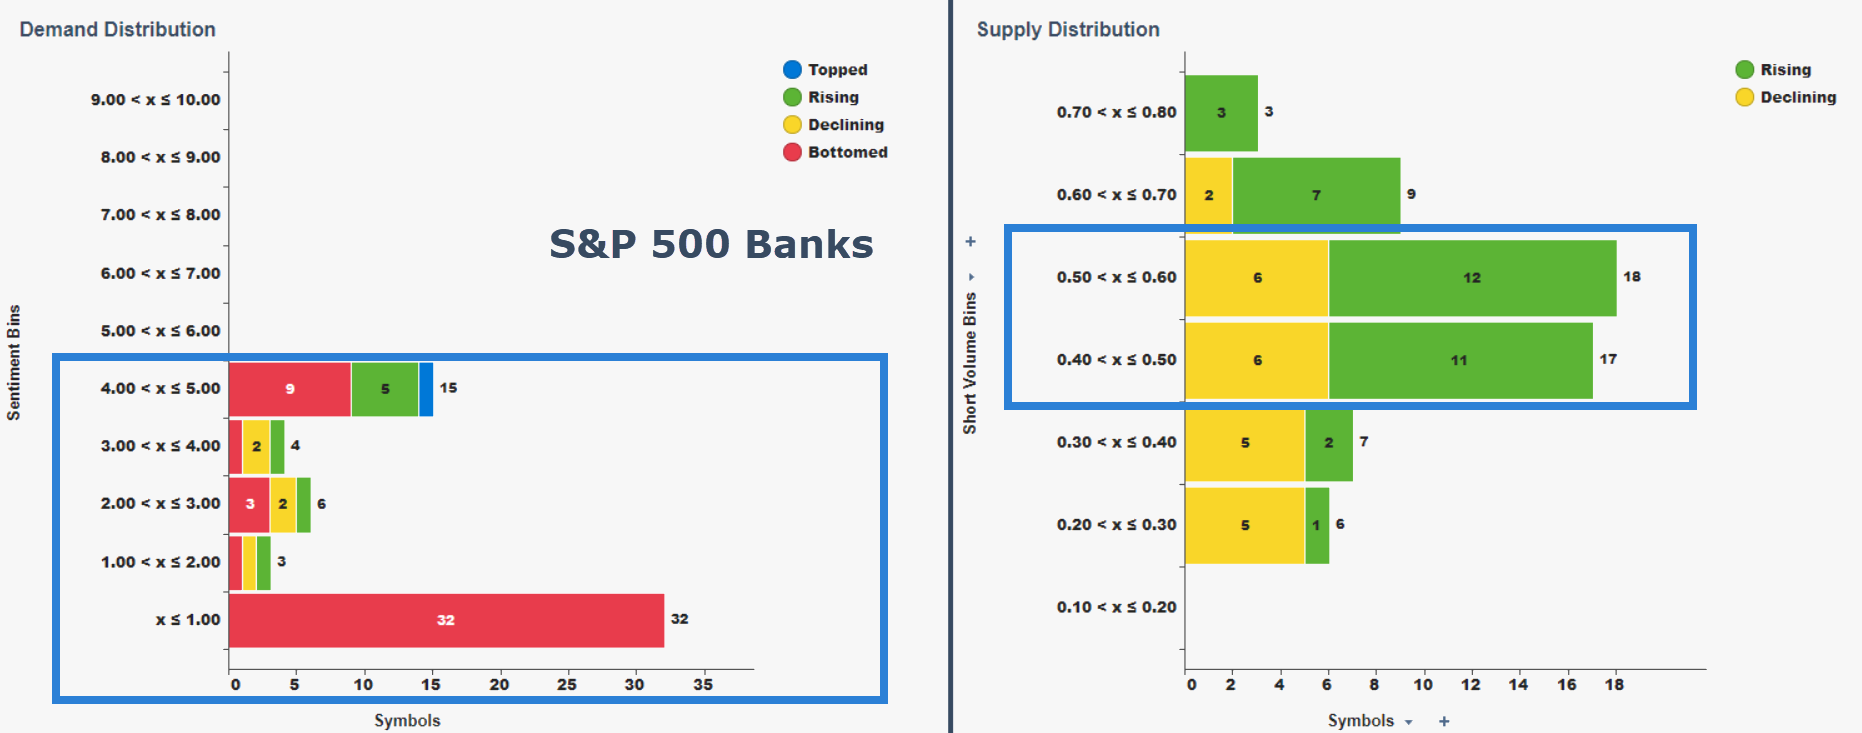
Our market structure sentiment distributions display demand and supply histograms. In the left Demand Distribution histogram, most S&P 500 Banks have bottomed demand profiles (red) and all banks have demand under 5. In the right Supply Distribution histogram, most Banks have rising (green) rather than falling (yellow) short volume with peak supply concentration between 50 and 60% Furthermore, nearly 80% of banks have short volume supply over 50%. Thus, more than half of prior day (8/31) volume was manufactured stock produced by market makers.
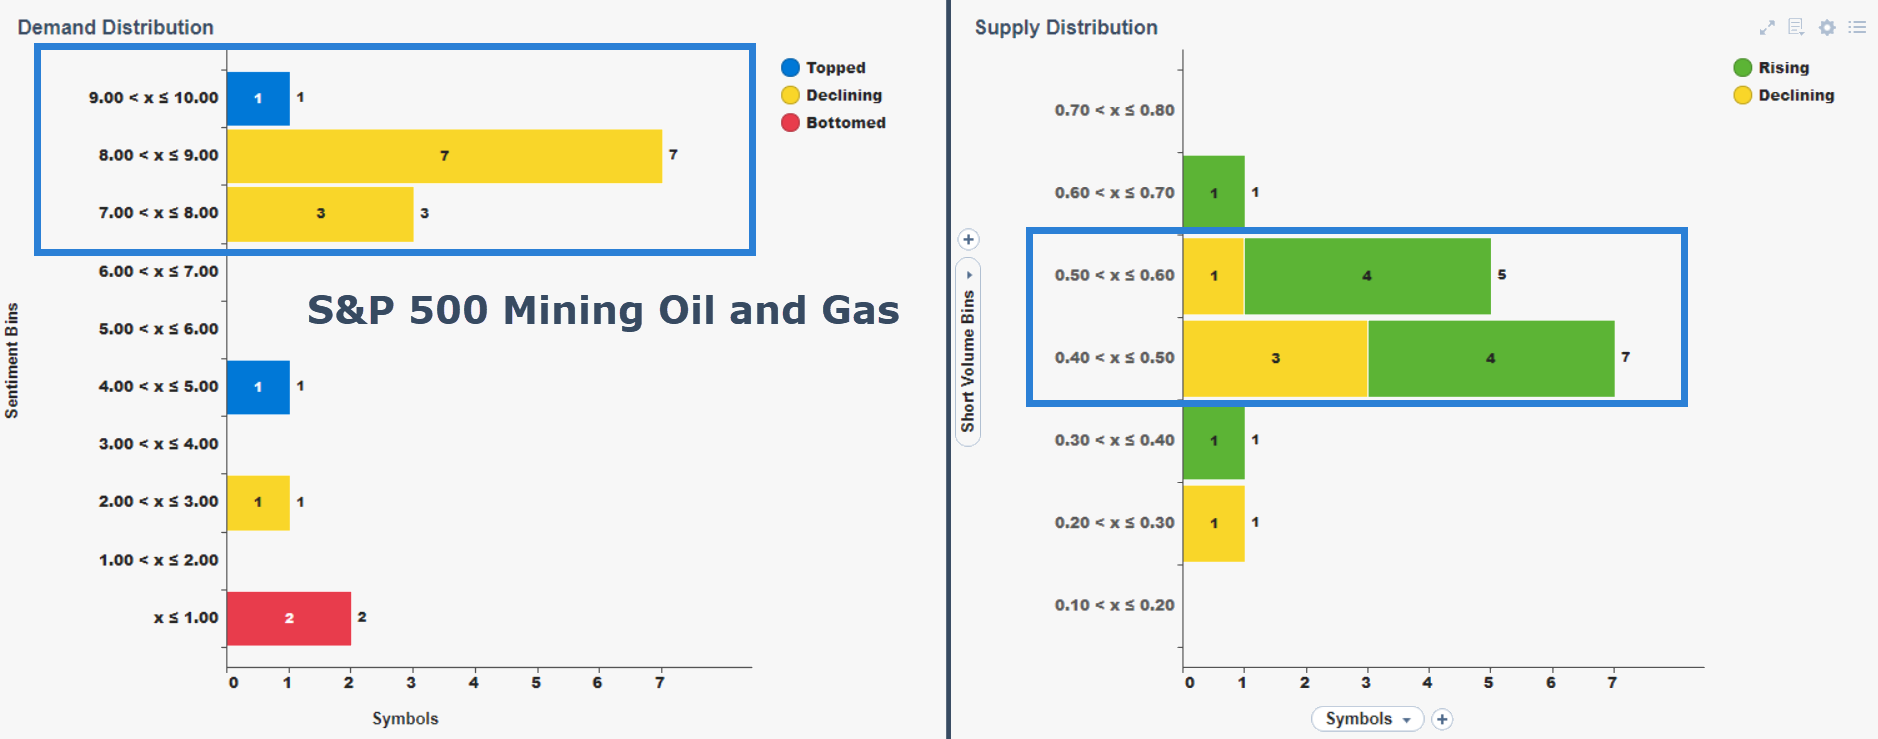
The Mining, Oil, and Gas stocks have a very different profile. Most components have demand sentiment between 7 and 10 and short volume supply under 50%. As compared to Mining Oil and Gas stocks, Banks have relatively low demand and high supply. We also observe the demand cycle of Banks bottoming, while most Mining, Oil, and Gas demand is declining. Both sectors exhibit rising supply profiles.
Broad Market Structure Sentiment
To complete our understanding of market structure sentiment context we look at the broad market. The average demand and supply of the S&P 500 is a critical element of market structure sentiment. Let’s widen our lens from Banks and Mining, Oil, and Gas stocks to the entire S&P 500.
Now we can observe the strongest Banks and Mining, Oil, and Gas companies across the entire S&P 500. The Banks distribution observed above is more consistent with the broad market than the Mining, Oil, and Gas distribution. Like Banks, most of the S&P 500 has a bottoming demand cycle (red).
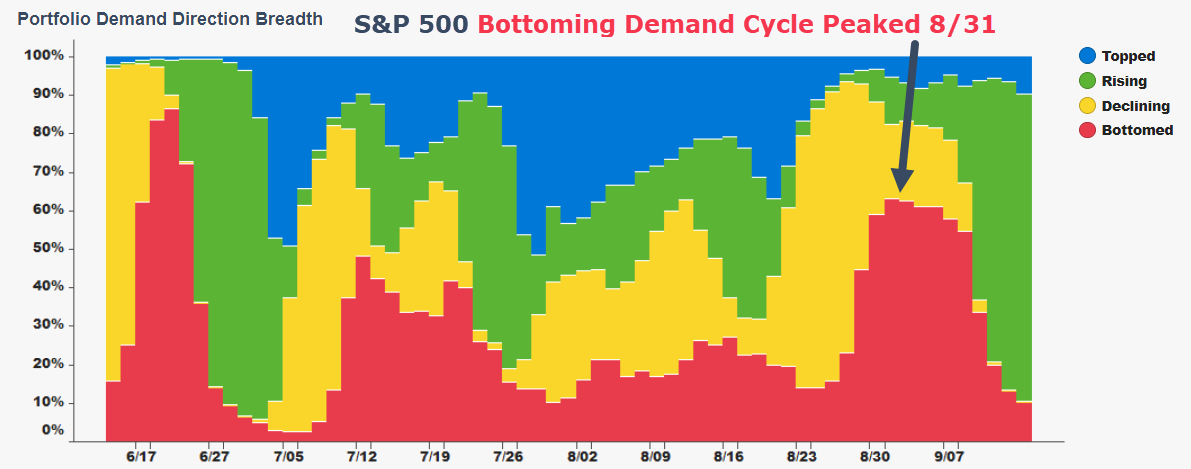
Bottoming cycles vary in duration which is why we also monitor demand direction breadth across the broad market. Here the bottom cycle peak preceded a 5% rally from 9/6 to 9/12.
This leads us to a macro view of broad market structure sentiment trends. Price is overlaid on demand sentiment above short volume. Note the short volume supply bottom coinciding with the August market top 8/16. This activity is followed by extreme levels of high supply in September which has muted rising demand. Persistent, elevated supply and the demand cycle moving from rising to declining (green to yellow) would be a negative market structure sentiment setup.

Summary
Market structure sentient is an underappreciated representation of demand and supply market dynamics that set prices. An understanding of how key investor behaviors and market maker short volume activity combine to influence prices can help asset managers and service providers optimize alpha generation strategies and risk management practices.
This analysis reviewed a non-exhaustive set of market structure sentiment elements.
Broad Market Structure Sentiment
Demand supply context of market structure health.Divergence and Convergence
Understanding the relationship between demand and supply and how divergences can identify relative market structure strength and weakness.Distributions
Interpreting the shape of sentiment demand and short volume supply.Demand Cycles
Tracking demand breadth across topping, rising, declining, and bottoming cycles.Relative Strength and Weakness
Applying context to analysis across stocks, sectors, portfolios, and benchmarks.
For the full story of market structure sentiment, see “An Alt-Data Story Explainer”.
Short volume does not equal short interest. The following are quotes from the foremost expert on short volume, Tim Quast, collected from his Market Structure Map:
“The SEC permits intermediaries to create stock when no real supply exists to satisfy it. That is, they can short stocks without borrowing… Somebody shorted the stock to make it available for sale at a higher price. Sound cognitively dissonant? It’s not. It’s called a “market-making exemption”… from Reg SHO Rule 203(b)(2)… the biggest source of shorting in the stock market.”
“Short volume, daily trading on borrowed or created stock…The supply chain of the stock market… short volume is inventory today, not mainly bets on declining stocks. It’s the supply that keeps demand from destabilizing prices, in effect. A drop from 48% to 43% is a 10% swoon, a cranial blow to inventory... Higher short volume restrains prices because it increases the available supply. If demand slows, then excess supply weighs on prices, and stocks decline.”
Short interest is the number of shares that have been sold short but have not yet been covered or closed out. Short interest, which can be expressed as a number or percentage, is an indicator of market sentiment. - Investopedia
.png)


